
View Class Reports in Digital Oral Reading Records Reports
If you're looking for a particular section of View Class Reports in Digital Oral Reading Records Reports, use the links below to quickly move to that section:
Class Reading History Overview
Class Fluency Analysis: Fluency Progress over Time
Class Fluency Analysis: Words Correct per Minute Progress
Creating and Editing Oral Reading Record Groups
Filter Reports using Groups in Oral Reading Record Reports
Class Reading Level Progress
View a summary of your class’ Reading Level Progress by selecting the Reading Level Progress tab on the Reports page. Ensure Class is selected at the top.
The report displays your class’ reading performance over time. The bubbles represent the percentage of your rostered students’ who have scored in a particular reading level range during a particular month. The size of each bubble represents the percentage of students who took a reading record. The color of the bubble shows the student’s Proficiency score on the record.
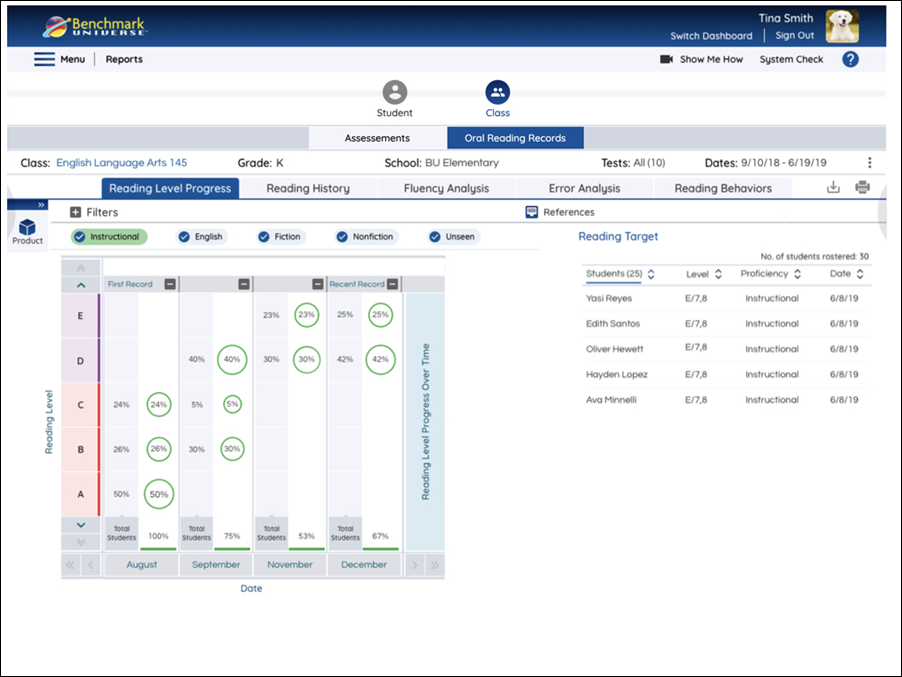
- The rows on the Y Axis correspond to Reading Level.
- The columns on the X Axis correspond to the month that the assignments were completed. Depending on your Filter settings, each month can be further split into three columns to display bubbles for assignments on which students scored Frustrational, Instructional or Independent.
- A bubble’s location on the Y axis shows the text’s Reading Level.
- Each bubble displays the percentage of students who took a reading record. This value is calculated using the total number of students rostered in the class. Each bubble only includes up to one record for each student. If a student completes more than one assignment in a month, only that student’s latest assignment is included in the percentages.
- You may select multiple bubbles in a particular month to see the students whose assignments are included in those bubbles in a table to the right. The table lists the student name, the level, the student’s proficiency score, and the date of the assignment.
- By default, no bubbles are selected.
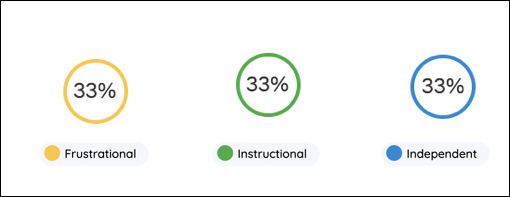
- The color of the bubble shows which Proficiency score those students achieved on these assignments. This key shows each Proficiency bubble with its associated filter option:
- First Record: the first month that a record was taken has the First Record label at the top of its column. While the rest of the month columns contain the most recent of each student’s records (if they have taken more than one that month), this column shows the earliest. The First Record month provides the teacher a starting point for how the class is improving over the year.
- Recent Record: the most recent month that a record was taken has the Recent Record label at the top of its column. This gives you an idea of how the class is doing currently.
- Use the blue navigation arrows on the bottom corners of the Reading Level Progress chart to view data for assignments taken on other dates. The single arrow will show you other assignments by changing the columns one at a time. The double arrow will skip all the way to the first or last column.
Class Reading History Overview
View a summary of all the Digital Oral Reading Records taken in a class with the Class Reading History Overview. Each row represents a single record. By default, the list is sorted with the most recent records at the top. Use the arrows at the top of the columns to sort the list by different categories.
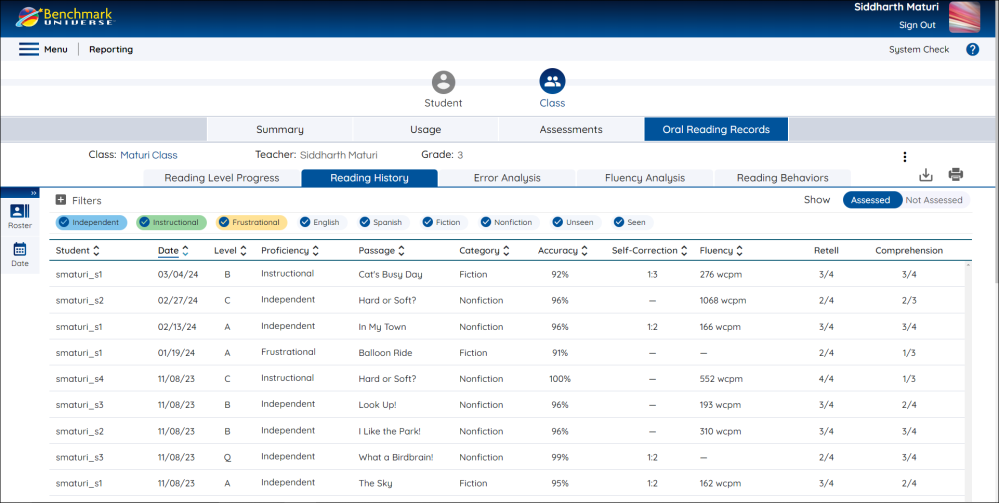
Each row contains the following information:
- Student Name
- Date
- Reading Level
- Proficiency Performance (Frustrational, Instructional or Independent)
- Passage Title
- Category (Fiction/Nonfiction)
- Accuracy
- Self-Correction Rate
- Fluency (words correct per minute)
- Retell score
- Comprehension score
Class Fluency Analysis
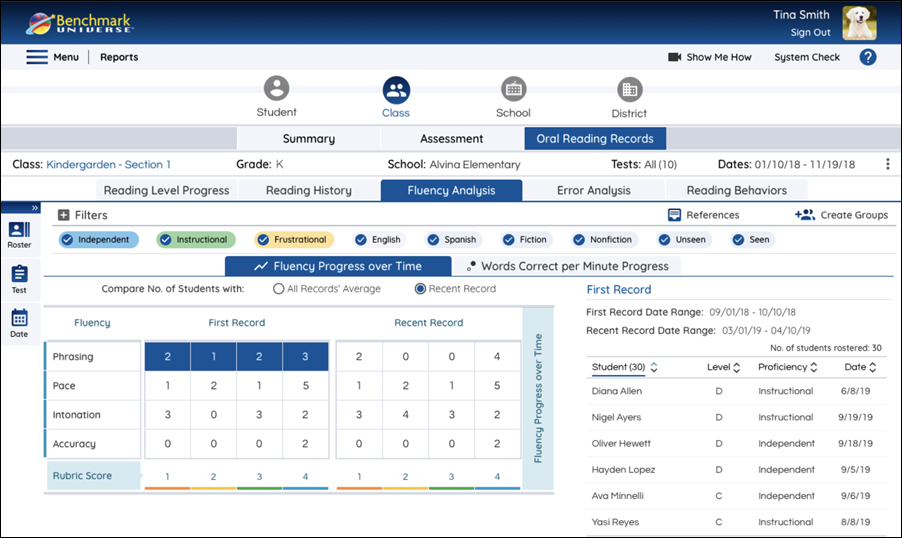
View a summary of your class' Fluency Analysis by selecting the Fluency Analysis tab on the Reports page. Ensure Class is selected at the top.
Fluency Progress over Time
This report displays a summary of your students’ Fluency Progress Over Time. It shows how many students have scored at a particular Fluency level according to your rubric evaluations given on the Analysis step of an Oral Reading Record. It helps you identify class-wide trends in Fluency performance to inform your instruction.

|
since Fluency is an optional step when conducting an Oral Reading Record, there may not be a report to display. If there is no rubric data for any students, you will see a message that says “No Fluency Analysis Tracked”. Try marking some Fluency and Accuracy categories on the Analysis step when marking an Oral Reading Record. (see Analyze a Student’s Record) |
- Each number in the cell represents how many students have scored at a particular Fluency level. Select a cell to see a full list of which students made the error the specified number of times. The list appears in the table to the right.
- The left section of the report (First Record) shows a summary of Fluency and Analysis scores from the first record students completed.
- The buttons above the chart let you switch the data in the second column — you can view data for each students’ most recent record (the Recent Record button) or you can see an average of students’ fluency scores on all records (the All Records’ Average button).
- The rows on the Y axis correspond to student performance in four Fluency and Accuracy categories:
- Phrasing
- Pace
- Intonation
- Accuracy
- The rows on the X axis correspond to the four Fluency performance levels, 1, 2, 3 and 4. Hovering over any of the levels will show you full description of that performance level.
Fluency Analysis report is the teacher’s subjective overview of a student’s fluency according to your rubric evaluations. For an objective calculation of a students’ Fluency according to their Words Correct Per Minute Progress across their Oral Reading Records, select the Words Correct Per Minute Progress tab on the Fluency Analysis report (see Words Correct Per Minute Progress above).
Words Correct per Minute Progress
This report displays your students’ Words Correct per Minute (wcpm) Progress over time. Words Correct per Minute is a measure of students’ Fluency.
The bubbles represent the percentage of your rostered students whose fluency rate is in the low, middle, or high percentile range for your class in each month.
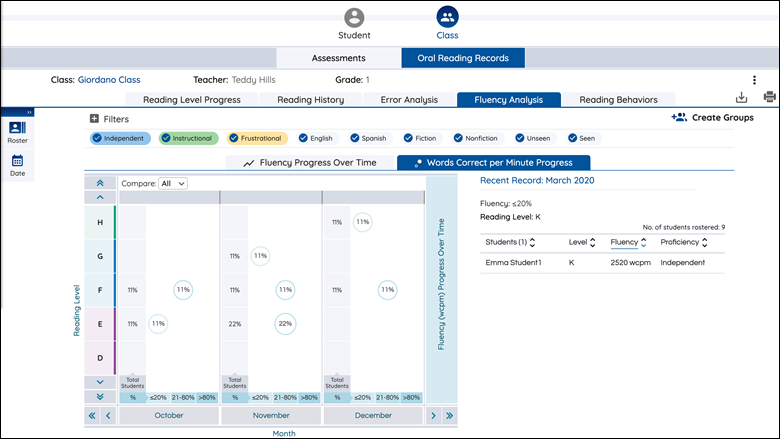
- The rows on the Y Axis correspond to the Reading Level of the assignment in which the student achieved the fluency rate.
- First Record: the first month that records were taken in your class has the First Record label at the top of its column. The First Record month provides you a starting point for how the class is improving over the year.
- Recent Record: the most recent month that records were taken has the Recent Record label at the top of its column. This gives you an idea of how the class is doing currently.
- Within each month on the X axis are three smaller columns, which represent the percentile range for students’ fluency performance:
- The leftmost column is ≤20%, meaning their fluency was in the lower 20th percentile for your class.
- The students falling in the middle column are in the 21st-80th percentile of your class for their fluency rate.
- The students in the right column are in the 80th or greater percentile for your class for their fluency rate.
- Each bubble displays the percentage of students whose reading record lands in that range. This value is calculated using the total number of students rostered in the class. Each bubble only includes one record for each student. If a student completes more than one assignment in a month, only that student’s latest assignment is included in the percentages.
- You may select multiple bubbles in a particular month to see the students whose fluency scores are included in those bubbles in a table to the right. The size of each bubble reflects how large the percentage is. The table on the right lists the:
- Student name
- Reading Level of the assignment in which the student scored the Fluency rate
- Student’s Fluency (Words Correct Per Minute) on that assignment
- Proficiency level of assignment
- By default, no bubbles are selected. You can only select bubbles within one month at a time.
- Use the blue navigation arrows on the bottom corners of the Reading Level Progress chart to view data for assignments taken other dates. The single arrow will show you other assignments by changing the columns one at a time. The double arrow will skip all the way to the first or last column.
- Use the References page to view the Oral Reading Records fluency norms for both Spanish and English.
Class Error Analysis
View your class’ Error Analysis report by selecting Oral Reading Records on the Report Type Selector tab. Make sure Class is selected at the top. Then select the Error Analysis tab.
The table on the left shows how many students have made a certain number of each type of error (or used Meaning, Structural, or Visual sources of information) across all their assignments. Select a cell to see a full list of which students made the error the specified number of times. The list appears in the table to the right.
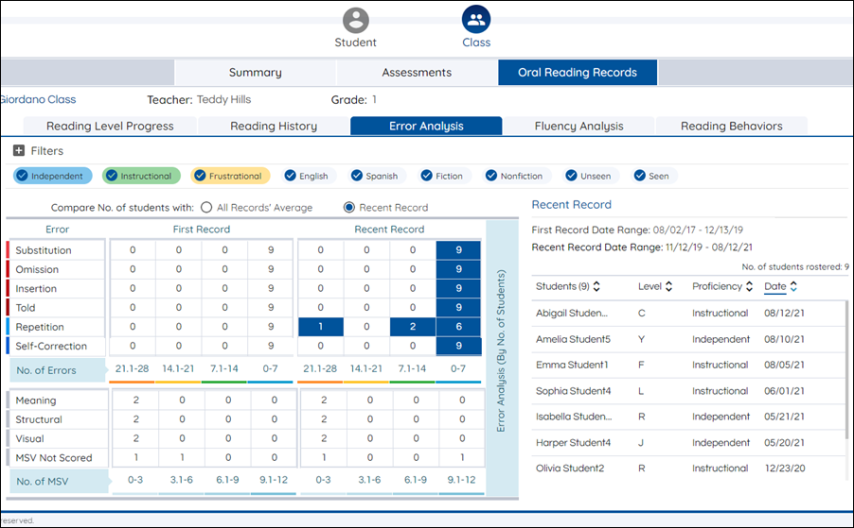
The left section of the table (“First Record”) shows a summary of reading behaviors from the first record students completed. The buttons above the chart let you switch the data in the second column — you can view data for each students’ most recent record (the Recent Record button) or you can see an average of students’ reading behaviors on all records (the All Records’ Average button).
Reading Behavior section:
- The top section of the table is the Reading Behaviors section. The Y Axis lists all of the possible reading behaviors students can make on an oral reading record.
- Each column on the “No. of Errors” X Axis displays a range of how many reading behaviors the students in that column made for each type of reading behavior.
- Each cell shows how many students made a reading behavior a certain number of times.
- For more information about different reading behaviors, see Marking an Oral Reading Record Passage.
Meaning, Structural, and Visual section:
- Below the Reading Behaviors is the MSV section of the table.
- The Y Axis lists all of the possible MSV sources of information students can use on an oral reading record.
-
Each column on the “% of Analysis” X Axis shows range for the percentage of times a student uses a particular MSV source.
- Each cell shows how many students used a particular MSV source a certain percentage of the time.
- For more information about Meaning, Structural and Visual sources of information, see MSV Coding Systems.
Reading Behaviors
This report displays a summary of your class’ Reading Behaviors on students’ Oral Reading Records throughout the year. It helps you understand the reading techniques your students are using or neglecting while trying to read a text and identify class-wide trends.
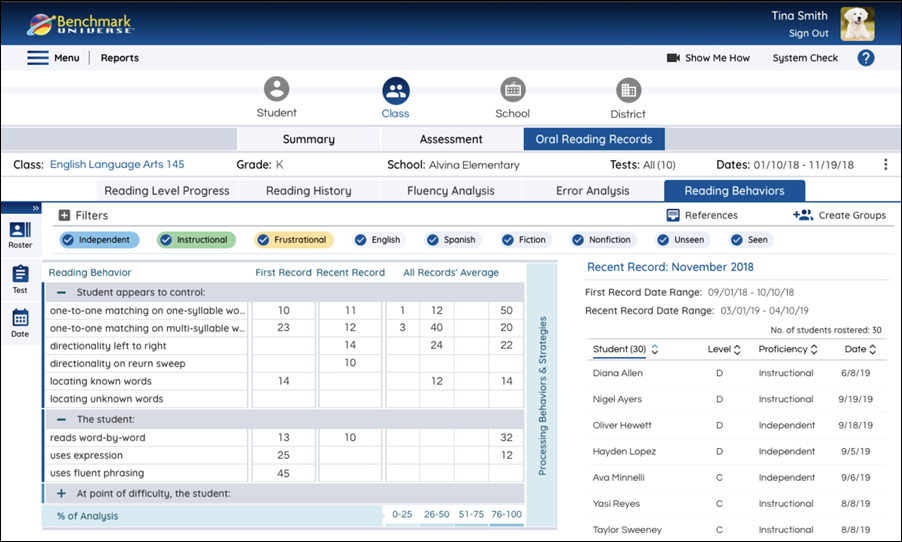
View your class’ Reading Behaviors report by selecting the Reading Behaviors tab. The data in this graph comes from the evaluations given in the Processing Behaviors and Strategies section on the Analysis step of an Oral Reading Record.
|
|
Since Fluency is an optional step when conducting an Oral Reading Record, there may not be a report to display. If there is no rubric data for any students, you will see a message that says “No Fluency Analysis Tracked”. Try marking some Fluency and Accuracy categories on the Analysis step when marking an Oral Reading Record. (see Analyze a Student’s Record) |
- Each number in the cell represents how many students have exhibited a particular behavior. Select a cell to see a full list of which students exhibited the behavior. The list appears in the table to the right.
- You can view student behaviors for the First Record and Most Recent Record for which there is student data.
- You can also see a summary for all records in the All Records’ Average section. This section beaks down the percentage of times that students display a certain reading behavior across all the records they have taken. There are four percentage ranges: 0-25, 26-50, 51-75, and 76-100 percent.
- Reading Behavior categories are listed in the gray headers of the chart. These categories can be collapsed or expanded.
- Each category contains various descriptions of student behaviors. Hover over long truncated descriptions to read the full text.
- The categories and behaviors vary by the reading level of the text. Therefore, if the behavior could only be evaluated for one text the student read, and they exhibited the behavior, that student will be counted in the 76-100% column of All Records Average.
Toggle the Assessed/Not Assessed View
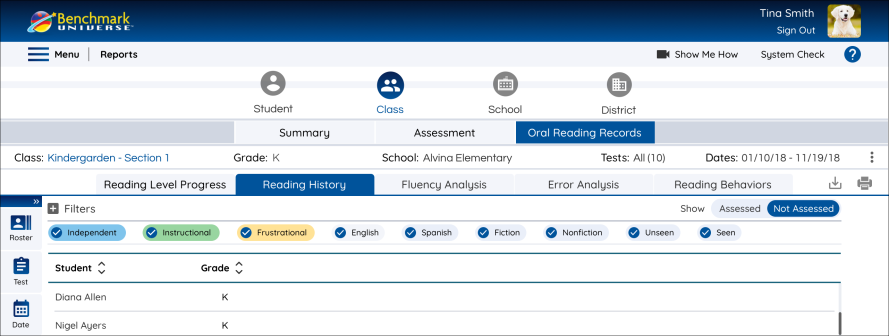
The Assessed/ Not Assessed toggle allows you to view, which students have not yet been assessed within your selected date range. This view is available at the Class, School, and District level.
Creating and Editing Oral Reading Record Groups
The Benchmark Reporting suite lets you group students by their Oral Reading Record performance to personalize your instruction. Drag and drop students to create small groups according to students’ Reading Level, Fluency, and Error Type performance.
|
|
You can also create groups according to assessment scores. Visit Create Grouping Reports to learn more. |
Access the Grouping screen
You can access the Grouping screen on most “Class” reports:
- Access Reports.
- Select Class in the Report Level Selector.
- Select Reading Level Progress, Fluency Analysis, or Error Analysis in Report Type Selector.
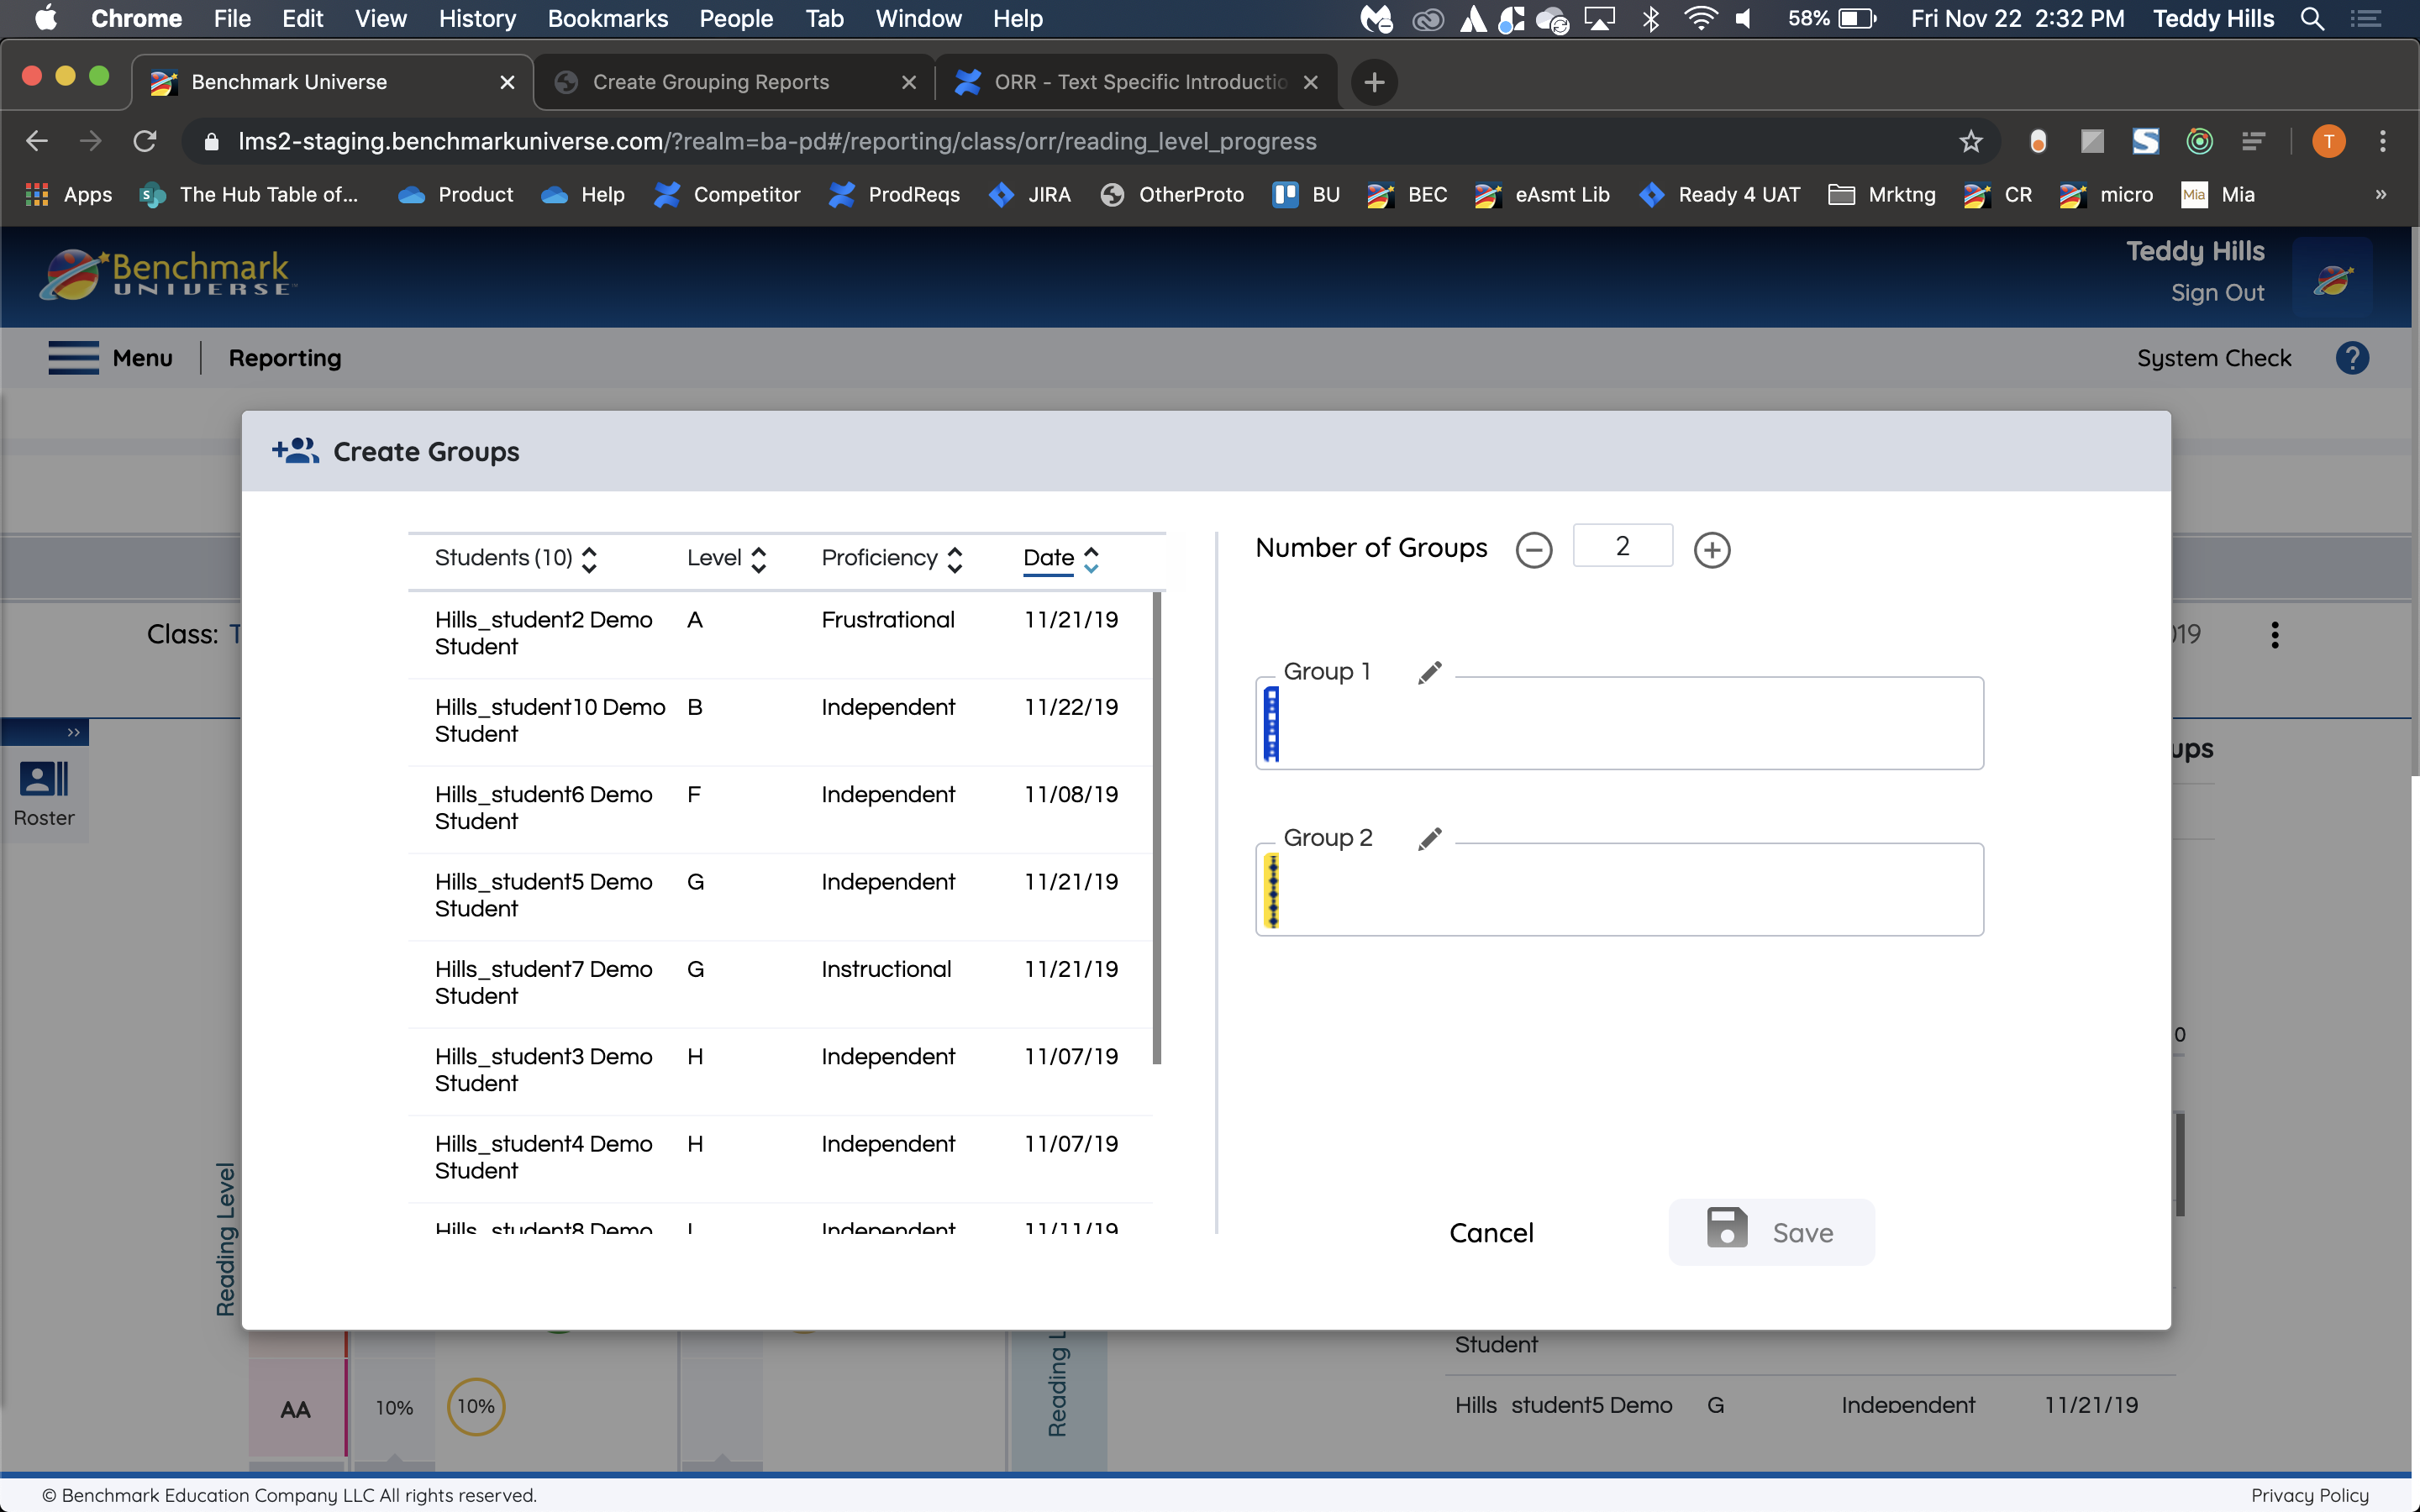
- Click Create Groups towards in the top right part of the Report.
- The Create Groups screen appears, showing the same list of students that was shown on the right of the report’s page. If you want to change the list of students shown, close the Create Groups screen and make another selection from the chart on the left.

Use the Create Groups page
The Create Groups page is where you can review the performance of your students to create groups. Use these steps to start creating groups for your classroom.
1. Select a sort option from the Student Table.
Use the up and down arrows to resort your students by Student Name or other metrics depending on the Report.
2. Select the number of groups in the Groups List.
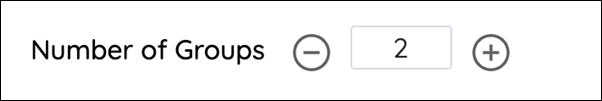
Use the minus and plus buttons next to “Number of Groups” to select how many groups you want to create. The box between the buttons lets you know how many groups you are creating — there are two by default. If there are more groups than fit on the screen, you will be able to scroll down and view the others.
3. Move students into groups and between groups.
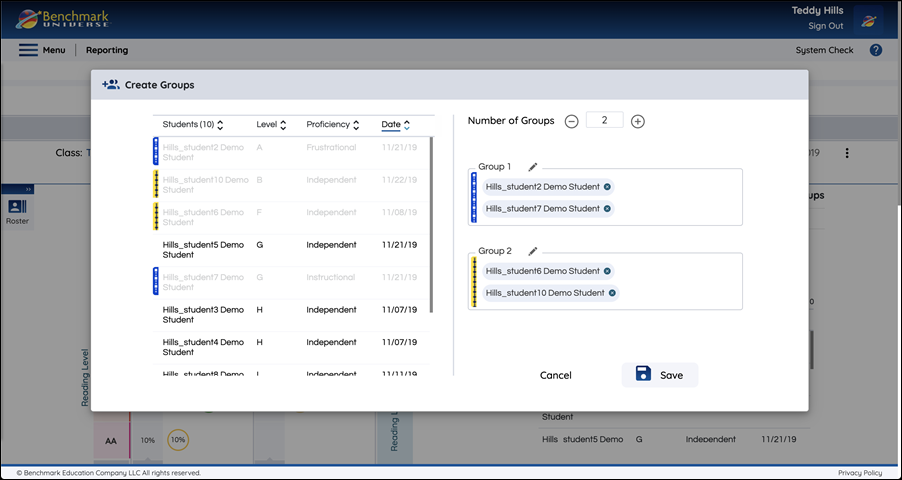
Grab a student tile from the Student List on the left side of the screen and drag it into any group in the Groups List on the right. You can also drag a student from one group to another group. A student cannot be in more than one group at once.
Each group has its own identifying color/pattern — when you add a student to a group, the identifying color/pattern appears next to that student’s name in the left of the screen. A student that has been added to a group will also be grayed out in the Student List on the left.
4. Edit Group Names.
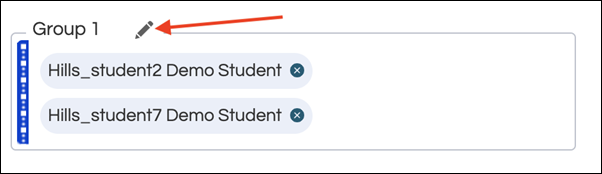
The Group names are “Group 1”, “Group 2”, etc. by default. Use the Pencil/Edit icon to change the name of the group. Just type in the text you’d like the Group name to be and then save the Group name by selecting the Pencil/Edit icon again or clicking outside of the text area.
5. Remove Students from Groups
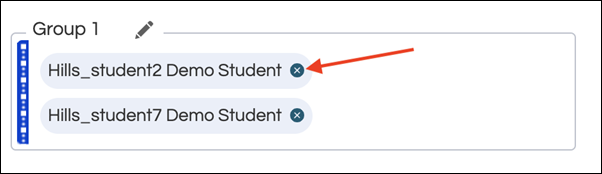
In order to remove a student from a group, select the (x) to the right of the student’s name in the Groups List.
6. Save Groups
When you want to save your groups, select the Save button. Your groups will be saved to your Manage Student section, you can always make modifications to your groups on this page. (See Manage Students for more information.) You can use your groups to create assignments in Benchmark Universe.
Filter Reports using Groups in Oral Reading Record Reports
You can Filter Reports using Groups in ORR Reports by following the steps below:
- In the reporting application, users can use the saved groups functionality to filter and generate the reports for a certain subset of students.
- Teacher and Administrator can utilize the saved groups in ORR reports via the Universal Selector in the reporting application.
- To select a Group(s) in the Reports application, the users should navigate to the ROSTER TAB in the Universal Selector
- From the Roster tab, a particular class needs to be selected.
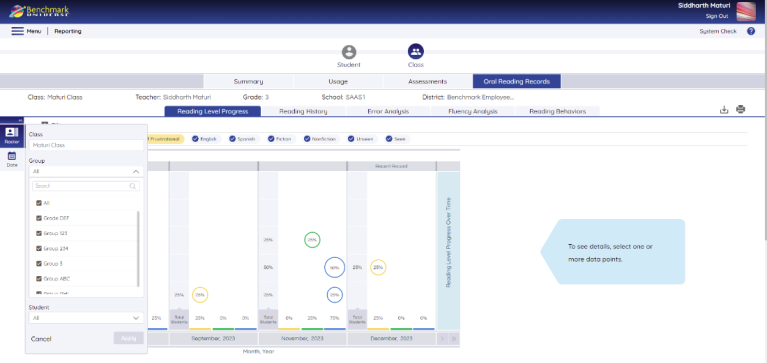
- Upon a class selection, a Groups dropdown will appear below the Class dropdown of the Roster Tab.
- Users can select All or custom select groups in the Groups dropdown. The Groups seen in the Group dropdown are a subset of the selected class only.
- The student dropdown in the Roster tab will be populated based on the Groups selected. Only students in selected groups will be seen in the Students Dropdown in the Universal Selector.
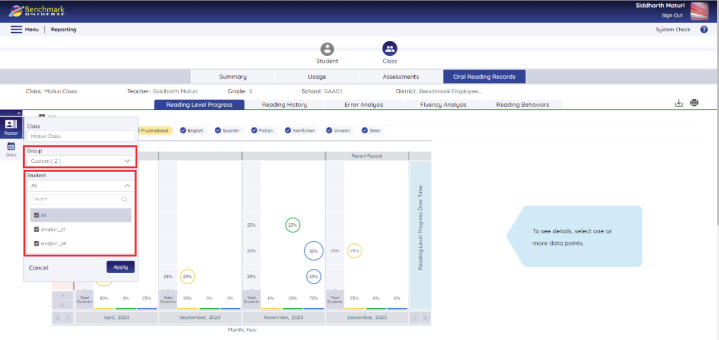
- Click Apply.
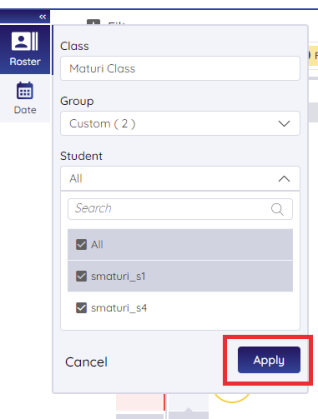
- The reports will be generated with the group(s) of students selected from the Universal Selector.